Page 11 of 30
PH10.7 | PH10.7 | Pharmacogenomics and Pharmacoeconomics in Drug Choice — SDL Guide — SDL Guide (Part 2)
Pharmacoeconomics: Methods for Evaluating Drug Value
Pharmacoeconomics applies economic methods to evaluate the costs and consequences of pharmaceutical products and therapies. It provides a structured framework for answering the question: 'Is this drug worth its cost?' — a question that is relevant at every level of the healthcare system, from a national formulary committee deciding what to reimburse to a prescriber choosing between two equivalent drugs for an individual patient.
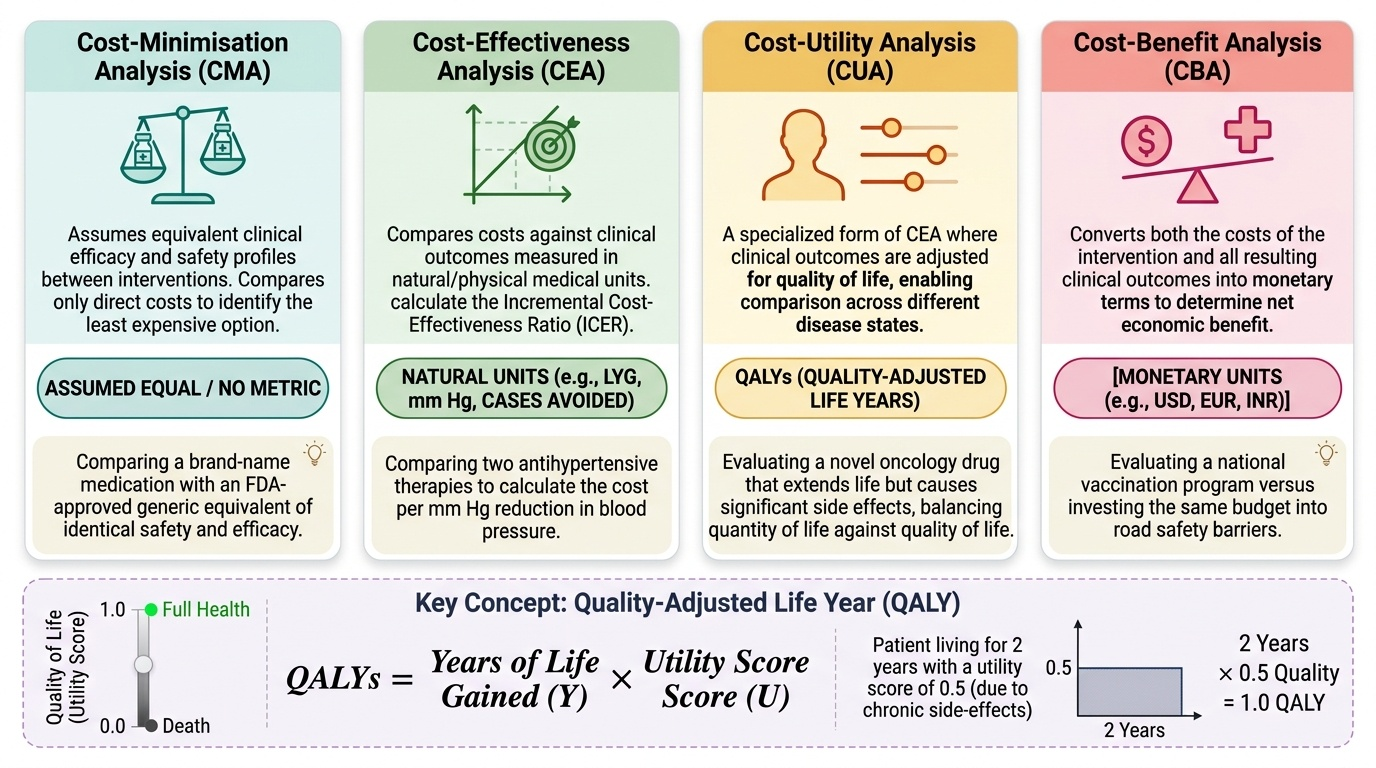
Four main types of pharmacoeconomic analysis are used, distinguished by how they measure the health outcome:
1. Cost-minimisation analysis (CMA): Assumes equivalent clinical outcomes between two or more interventions and compares only the costs. If Drug A and Drug B produce equivalent cure rates, safety profiles, and durations of therapy, the cheaper drug is preferred. This is the most straightforward analysis but requires good evidence of equivalence.
2. Cost-effectiveness analysis (CEA): Compares costs and clinical outcomes measured in natural units — additional life-years gained, reduction in hospital admissions, blood pressure points lowered. Expressed as an incremental cost-effectiveness ratio (ICER): (Cost of new drug − Cost of comparator) ÷ (Effectiveness of new drug − Effectiveness of comparator). A lower ICER = better value.
3. Cost-utility analysis (CUA): A variant of CEA that measures outcomes in quality-adjusted life years (QALYs) — life-years weighted by quality of life (1.0 = full health; 0 = death). This allows comparison across disease areas. The WHO's historical benchmark was that an intervention costing less than 1–3× GDP per capita per QALY may be cost-effective; India does not yet have a formally published ICER threshold, but healthcare technology assessment (HTA) is being developed under the HTAIn body.
4. Cost-benefit analysis (CBA): Converts all outcomes into monetary units, allowing direct comparison of costs and benefits in the same currency. Rarely used in clinical pharmacology due to ethical challenges of monetising health outcomes.
Provided image
QALY — the key concept: A drug that adds 2 years at 0.5 quality (e.g. significant disability) produces 1 QALY. A drug that adds 1 year at full health (1.0) also produces 1 QALY. The QALY allows comparison of interventions across different disease states on a single scale — though the assignment of quality weights to health states is contested and may vary across cultures.
SELF-CHECK
Drug A costs ₹500 per patient per year and reduces hospitalisations by 10 per 1000 patients. Drug B costs ₹200 per patient per year with a reduction of 8 hospitalisations per 1000. Each prevented hospitalisation is valued at ₹10,000. Which pharmacoeconomic analysis type would MOST directly compare these two drugs, and what is the approximate ICER of Drug A over Drug B?
A. A) Cost-minimisation analysis; ICER = ₹300 (cost difference only)
B. B) Cost-effectiveness analysis; ICER = (₹500−₹200) ÷ (10−8) per 1000 = ₹150 per prevented hospitalisation
C. C) Cost-utility analysis; ICER expressed in ₹/QALY
D. D) Cost-benefit analysis; both costs and benefits expressed in QALYs
Reveal Answer
Answer: B. B) Cost-effectiveness analysis; ICER = (₹500−₹200) ÷ (10−8) per 1000 = ₹150 per prevented hospitalisation
B is correct. When outcomes differ between the two drugs (10 vs 8 hospitalisations prevented), cost-minimisation analysis cannot be used (it assumes equivalent outcomes). Cost-effectiveness analysis is appropriate here, using natural outcome units (hospitalisations prevented). ICER = (500−200) ÷ (10−8) per 1000 patients = 300 ÷ 2 = ₹150 per additional hospitalisation prevented — this tells decision-makers what it costs per extra clinical benefit unit with Drug A vs Drug B. Cost-utility analysis would require outcomes in QALYs, not hospitalisations. Cost-benefit analysis would convert all outcomes to monetary value.
Applying Pharmacoeconomics: Finding the Price of Medication
A critical practical skill embedded in PH10.7 is the ability to find the actual price of a medication — comparing branded versus generic options and calculating the cost of a course of treatment. This skill directly serves patient interests: in a health system where out-of-pocket expenditure is the primary mode of healthcare financing for most Indians, the prescriber who routinely checks drug prices and communicates alternatives to patients is practicing genuine patient-centred care.
Practical resources for drug price lookup in India:
1. Jan Aushadhi Portal (janaushadhi.gov.in): Lists the prices of drugs available at Pradhan Mantri Bhartiya Janaushadhi Pariyojana (PMBJP) stores — generic medicines at 50–90% lower than branded equivalents. This is the most relevant resource for recommending affordable alternatives to patients.
2. NLEM/DPCO Price List: The price-controlled ceiling prices for NLEM drugs are published by the National Pharmaceutical Pricing Authority (NPPA). The NPPA website and mobile app allow verification of maximum retail prices for scheduled formulations.
3. CIMS/IDR (Indian Drug Review): A comprehensive commercial database of all drugs marketed in India with MRPs — useful for comparing multiple brands of the same molecule.
4. Chemist/pharmacy price comparison: The patient's local pharmacy or a Jan Aushadhi outlet can often provide real-world prices.
Worked example — price comparison:
A patient requires atorvastatin 40 mg daily long-term for secondary cardiovascular prevention.
- Branded atorvastatin (Lipitor-equivalent): approximately ₹20–30 per tablet → ₹600–900/month
- NLEM generic atorvastatin: ₹1–3 per tablet → ₹30–90/month via Jan Aushadhi
- Cost difference for one year: ₹6,840–10,560 (branded) vs ₹360–1,080 (generic)
- Both have the same active molecule; bioequivalence is a regulatory requirement for marketing approval
- For a patient on a secondary prevention regimen with multiple drugs (aspirin, statin, beta-blocker, ACEI) who must pay out-of-pocket, choosing NLEM generics across all drugs can reduce annual drug costs by ₹15,000–50,000
Communicating cost with patients:
Inform patients that generic and branded drugs contain the same active molecule at the same dose, and that regulatory bioequivalence approval means they are therapeutically equivalent. This conversation, conducted with empathy and without making the patient feel dismissed, is a core communication competency that links pharmacoeconomics to patient-centred prescribing.
Integrating Pharmacogenomics and Pharmacoeconomics in Clinical Decisions
The greatest clinical value of pharmacogenomics and pharmacoeconomics comes when they are integrated into the prescribing decision rather than applied as separate academic exercises. This integration is illustrated through two case scenarios that reflect real clinical decision points.
Case 1 — Pharmacogenomics changing the drug choice:
A 45-year-old man undergoes elective hip replacement. Post-operatively, he requires analgesia. Standard prescribing would use codeine phosphate 30 mg 4-hourly. However, his electronic medical record indicates he was previously genotyped as a CYP2D6 ultrarapid metaboliser — flagged because his mother is Indian and this variant has higher prevalence in some South Asian populations.
For an ultrarapid metaboliser, standard codeine doses produce unusually high morphine concentrations rapidly — risking opioid toxicity including sedation and respiratory depression. The pharmacogenomic information requires a drug change: substitute tramadol (also CYP2D6 metabolised, but with a more benign UM effect profile than codeine) or use a non-CYP2D6-dependent opioid (morphine directly, or oxycodone with dose guidance). Cost consideration: tramadol is also on the NLEM; both options are low-cost. Here, pharmacogenomics is the primary driver.
Case 2 — Pharmacoeconomics titling the choice between equivalent options:
A 60-year-old woman with type 2 diabetes on metformin needs add-on therapy. Her glycaemic control is HbA1c 8.5%. You consider sitagliptin (branded, ₹40/day) vs a generic DPP-4 inhibitor (vildagliptin, ₹12/day — generic available under DPCO pricing), both of similar clinical efficacy for her profile. She has no cardiovascular disease (which would have indicated preferring a GLP-1 RA or SGLT2i). No pharmacogenomic flag applies.
Pharmacoeonomic reasoning: Cost-minimisation analysis applies (similar outcomes). The generic vildagliptin at ₹12/day vs ₹40/day = ₹1,040/month saving. Over 5 years of treatment, this is approximately ₹62,000. For a patient paying out-of-pocket, this is not a trivial difference. Prescribing choice: generic DPP-4 inhibitor where clinically appropriate. Document the reasoning.
Integration principle: Pharmacogenomic information takes priority when there is a known clinical risk that changes drug choice. Pharmacoeconomic reasoning applies when clinical outcomes are equivalent — it selects the drug that achieves the same outcome at lower cost. Neither framework overrides patient preference or clinical judgment — they inform it.
CLINICAL PEARL
G6PD testing before primaquine is not optional in endemic India. G6PD deficiency affects 10–15% of populations in many parts of India (higher in some tribal communities). A patient given standard-dose primaquine (15 mg/day × 14 days for vivax malaria radical cure) without G6PD testing who has severe deficiency can develop life-threatening haemolytic anaemia within 48 hours. The test is simple, inexpensive, and widely available at district-level labs. This is a pharmacogenomic intervention with a clear cost-benefit: the haemolytic crisis is far more expensive to treat than the cost of the test, and the patient harm is avoidable.
Self-Assessment: Pharmacogenomics and Pharmacoeconomics
Work through these structured questions to confirm your understanding of both frameworks before proceeding to clinical pharmacology assessments.
Self-check 1 — Pharmacogenomics:
A patient prescribed azathioprine 2 mg/kg/day for autoimmune hepatitis develops severe pancytopenia at week 3. Blood counts show WBC 0.8×10⁹/L, platelets 45×10⁹/L. You suspect pharmacogenomic contribution. (a) Which enzyme deficiency is the most likely cause? (b) What is the mechanism of toxicity? (c) What should have been done before starting azathioprine?
Expected answers:
(a) TPMT (thiopurine S-methyltransferase) deficiency — this is the key enzyme metabolising azathioprine's thioguanine metabolites. (b) In TPMT-deficient patients, thioguanine nucleotides accumulate to toxic concentrations, causing myelosuppression (bone marrow suppression → pancytopenia). The mechanism is direct cytotoxicity to rapidly dividing bone marrow progenitor cells. (c) TPMT genotyping or enzymatic activity testing should be performed before initiating azathioprine. Patients with severely reduced TPMT activity require dose reduction of approximately 10–15 fold; homozygous deficient patients may need azathioprine avoidance entirely, with alternative immunosuppressants such as mycophenolate mofetil.
Self-check 2 — Pharmacoeconomics:
A hospital formulary committee is evaluating a new biological agent (Drug C, ₹80,000/year) vs the current first-line treatment (Drug D, ₹5,000/year). Drug C shows a 15% absolute risk reduction in hospitalisation over Drug D in a randomised trial. Each hospitalisation costs approximately ₹50,000. (a) Is this a cost-effectiveness or cost-utility analysis? (b) What is the ICER of Drug C over Drug D per hospitalisation prevented? (c) Should the hospital formulary committee consider other factors beyond the ICER?
Expected answers:
(a) Cost-effectiveness analysis — the outcome is in natural units (hospitalisations prevented), not QALYs. (b) ICER = (80,000 − 5,000) ÷ 0.15 = ₹75,000 ÷ 0.15 = ₹500,000 per hospitalisation prevented. Each prevented hospitalisation saves ₹50,000 — so the net cost per prevented hospitalisation is ₹500,000 − ₹50,000 = ₹450,000. This is expensive. (c) Yes — the committee should consider: the severity of the condition (is preventing hospitalisation the most important outcome, or would mortality reduction be more relevant?), the patient population's ability to pay or insurance coverage, whether the drug provides benefits beyond hospitalisation prevention (long-term disease modification, quality of life), and whether there are patients for whom pharmacogenomic selection could identify those most likely to benefit (precision medicine).